
Tags
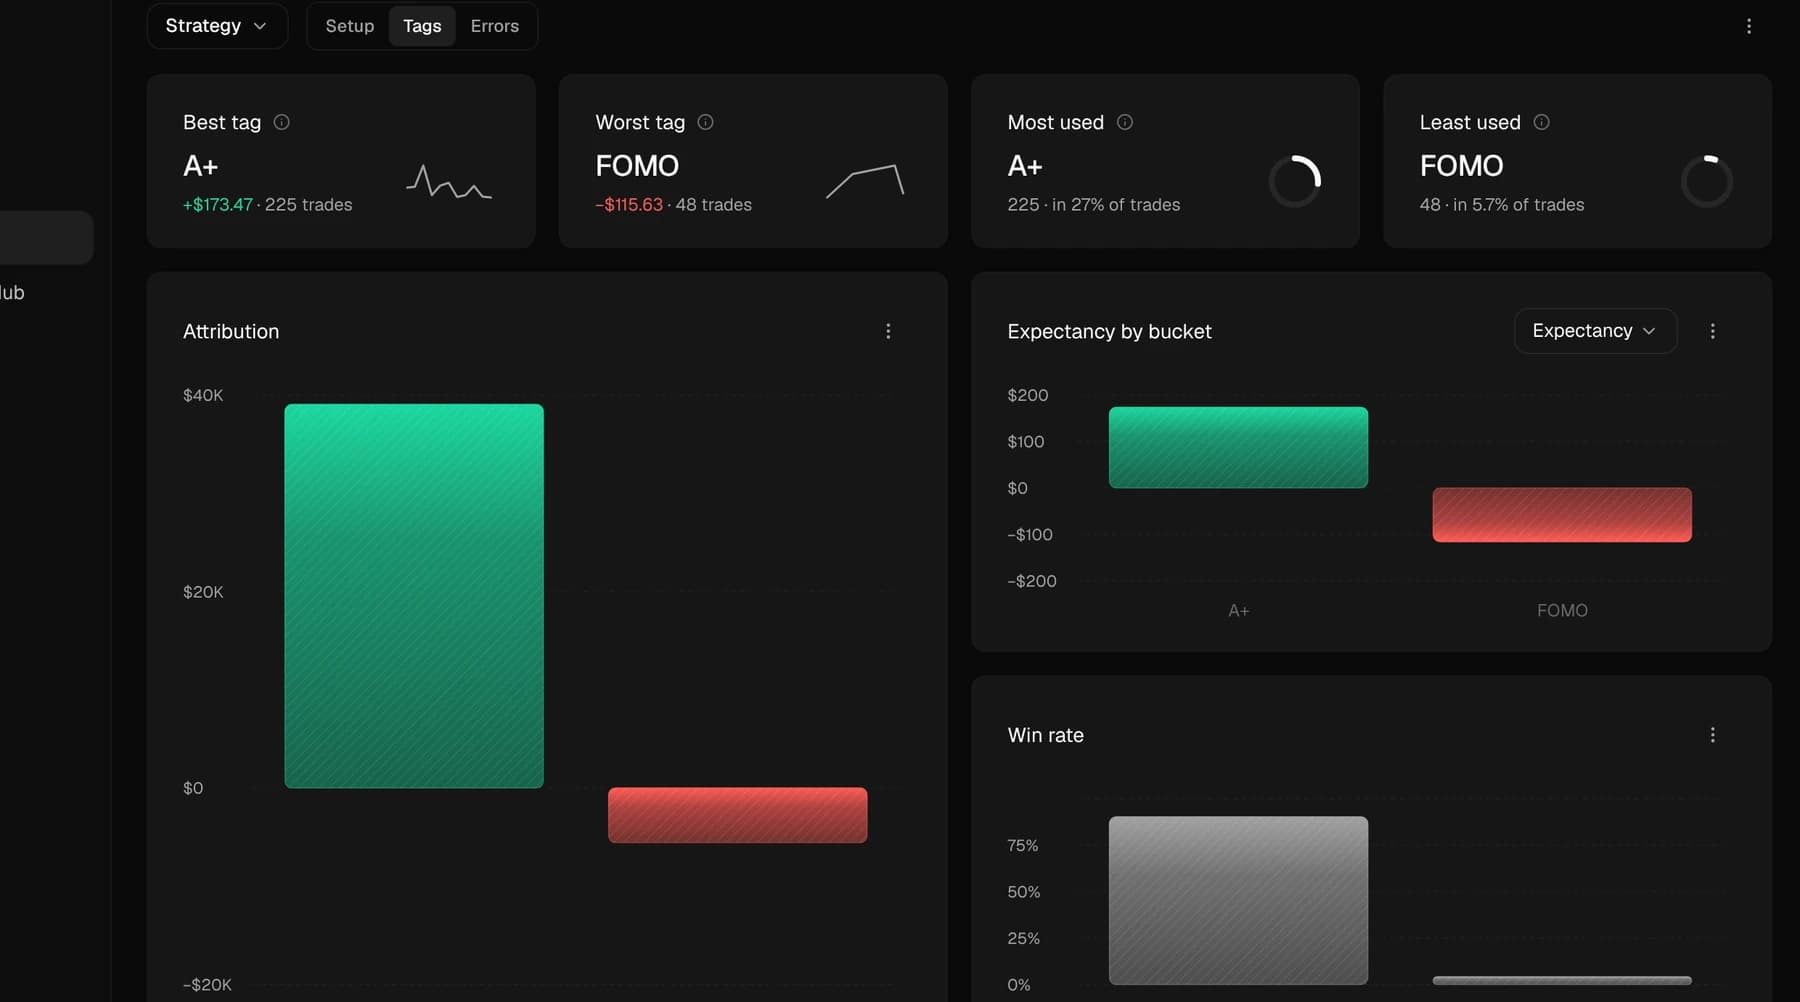
A+ setups made +$173.47 a trade over 225 trades. FOMO, −$115.63 over 48.
Every trading platform will tell you what you made. Almost none will tell you the conditions under which you made it, and that second question is the only one whose answer changes what you do tomorrow. Every chart is built from the trades in your journal, nothing entered twice.

Net P&L, win rate, profit factor and drawdown above the curve that built the account. Hover any point to see the day behind it, then read it by day, week or month.
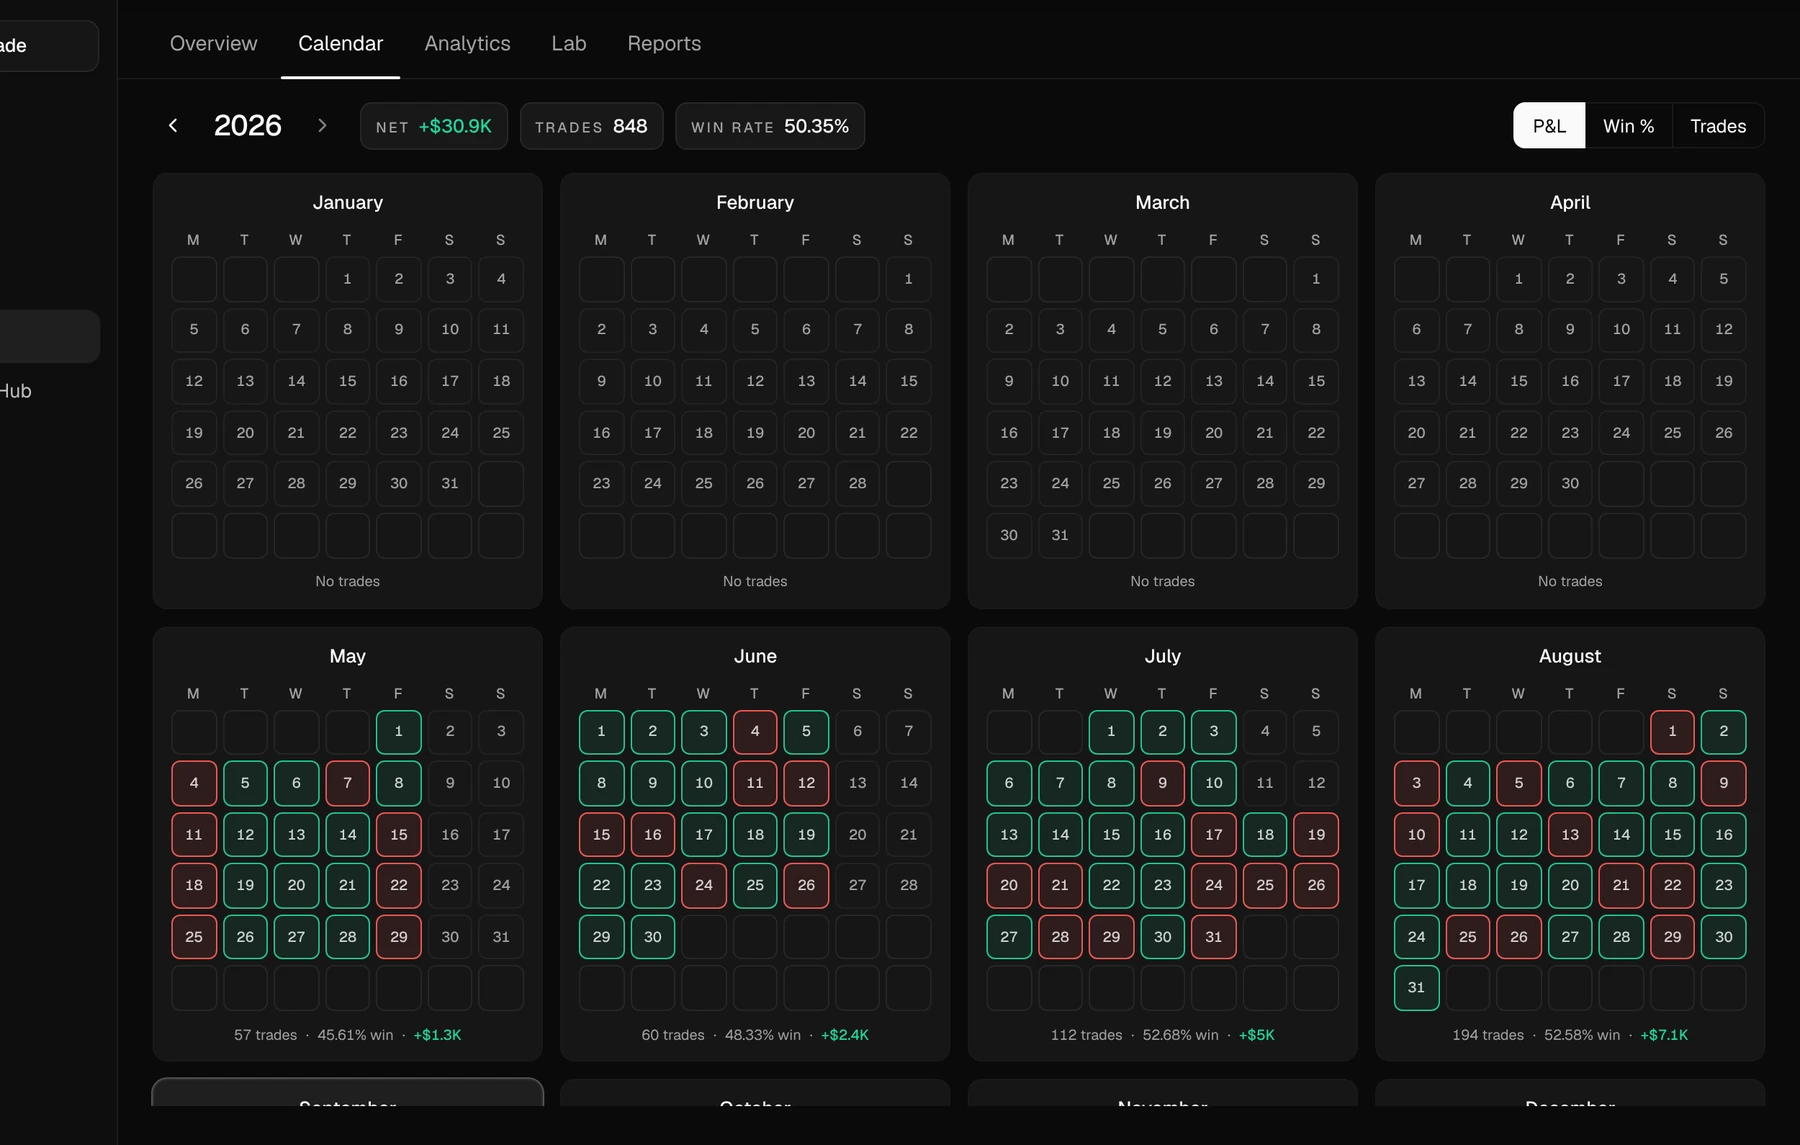
Every day with its P&L, trades and win rate, every week summed up beside it. Step back to the whole year in one click.
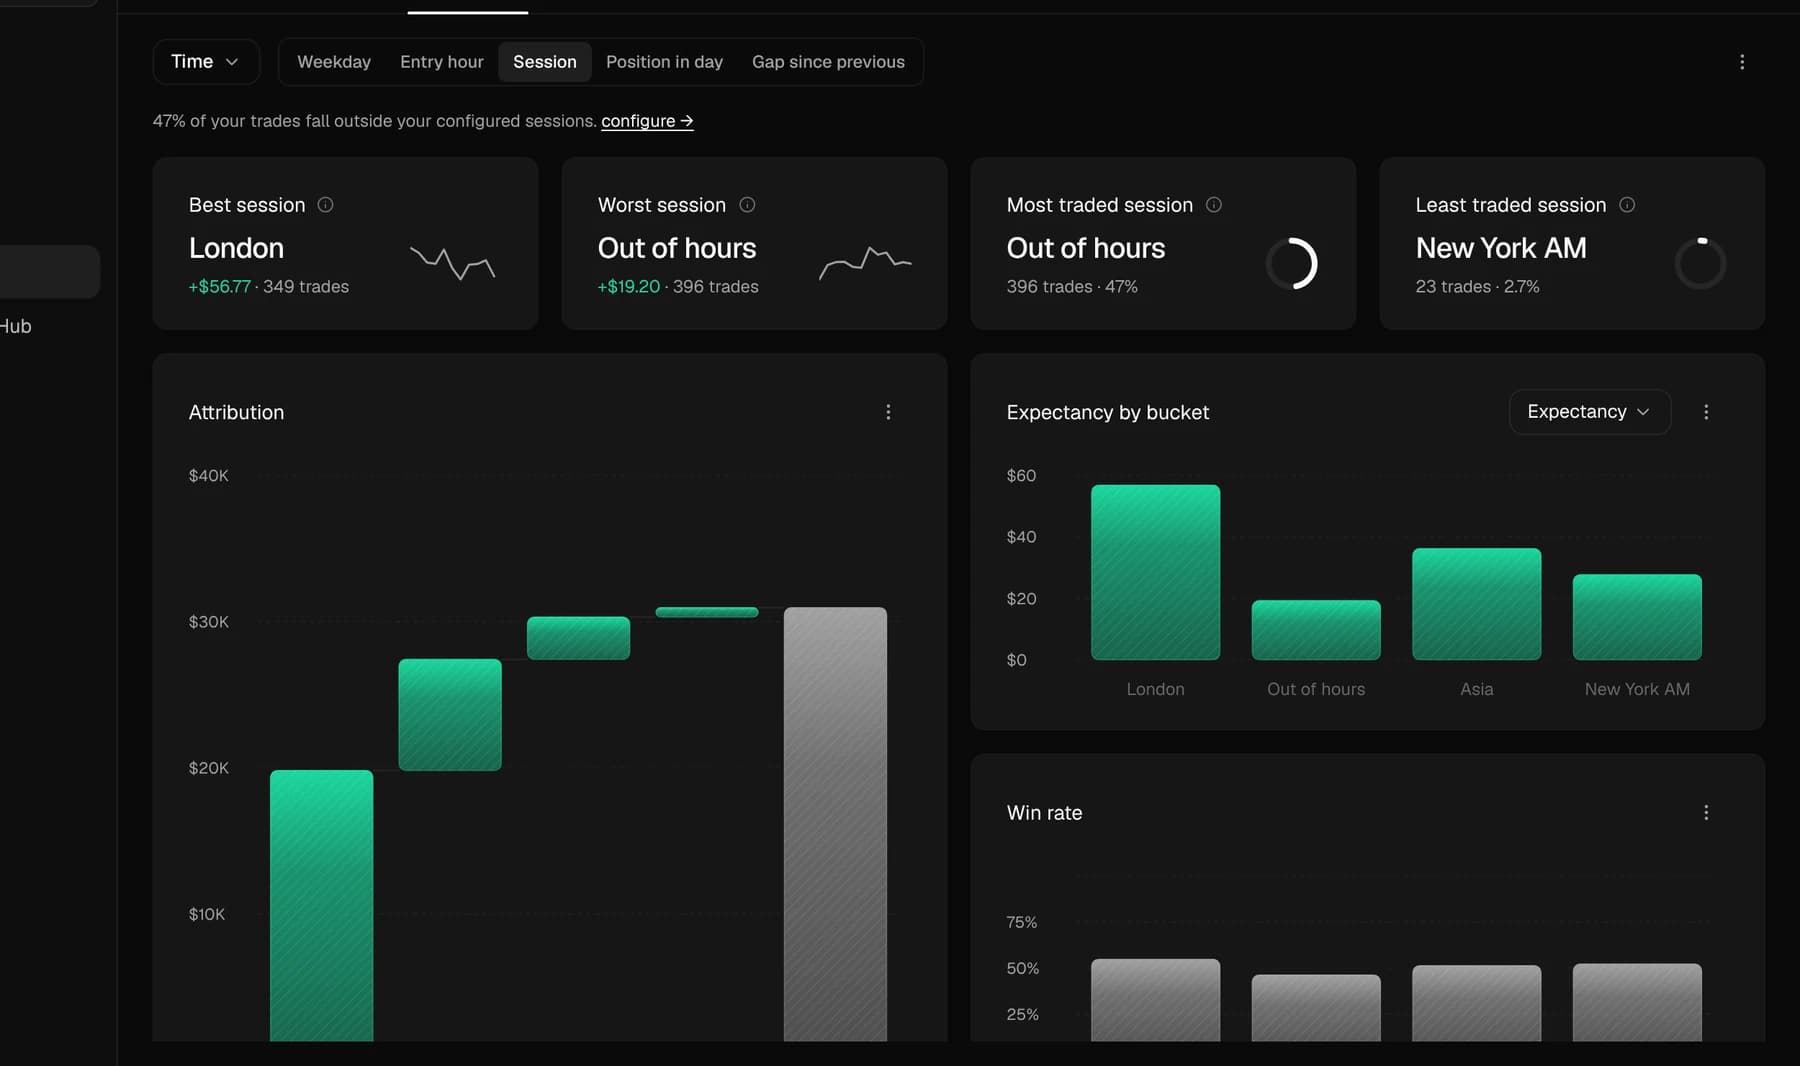
Time, instrument, risk, strategy, behaviour, outcome, execution, system and evolution. Every view is built from the trades you already have.
A+ setups made +$173.47 a trade over 225 trades. FOMO, −$115.63 over 48.
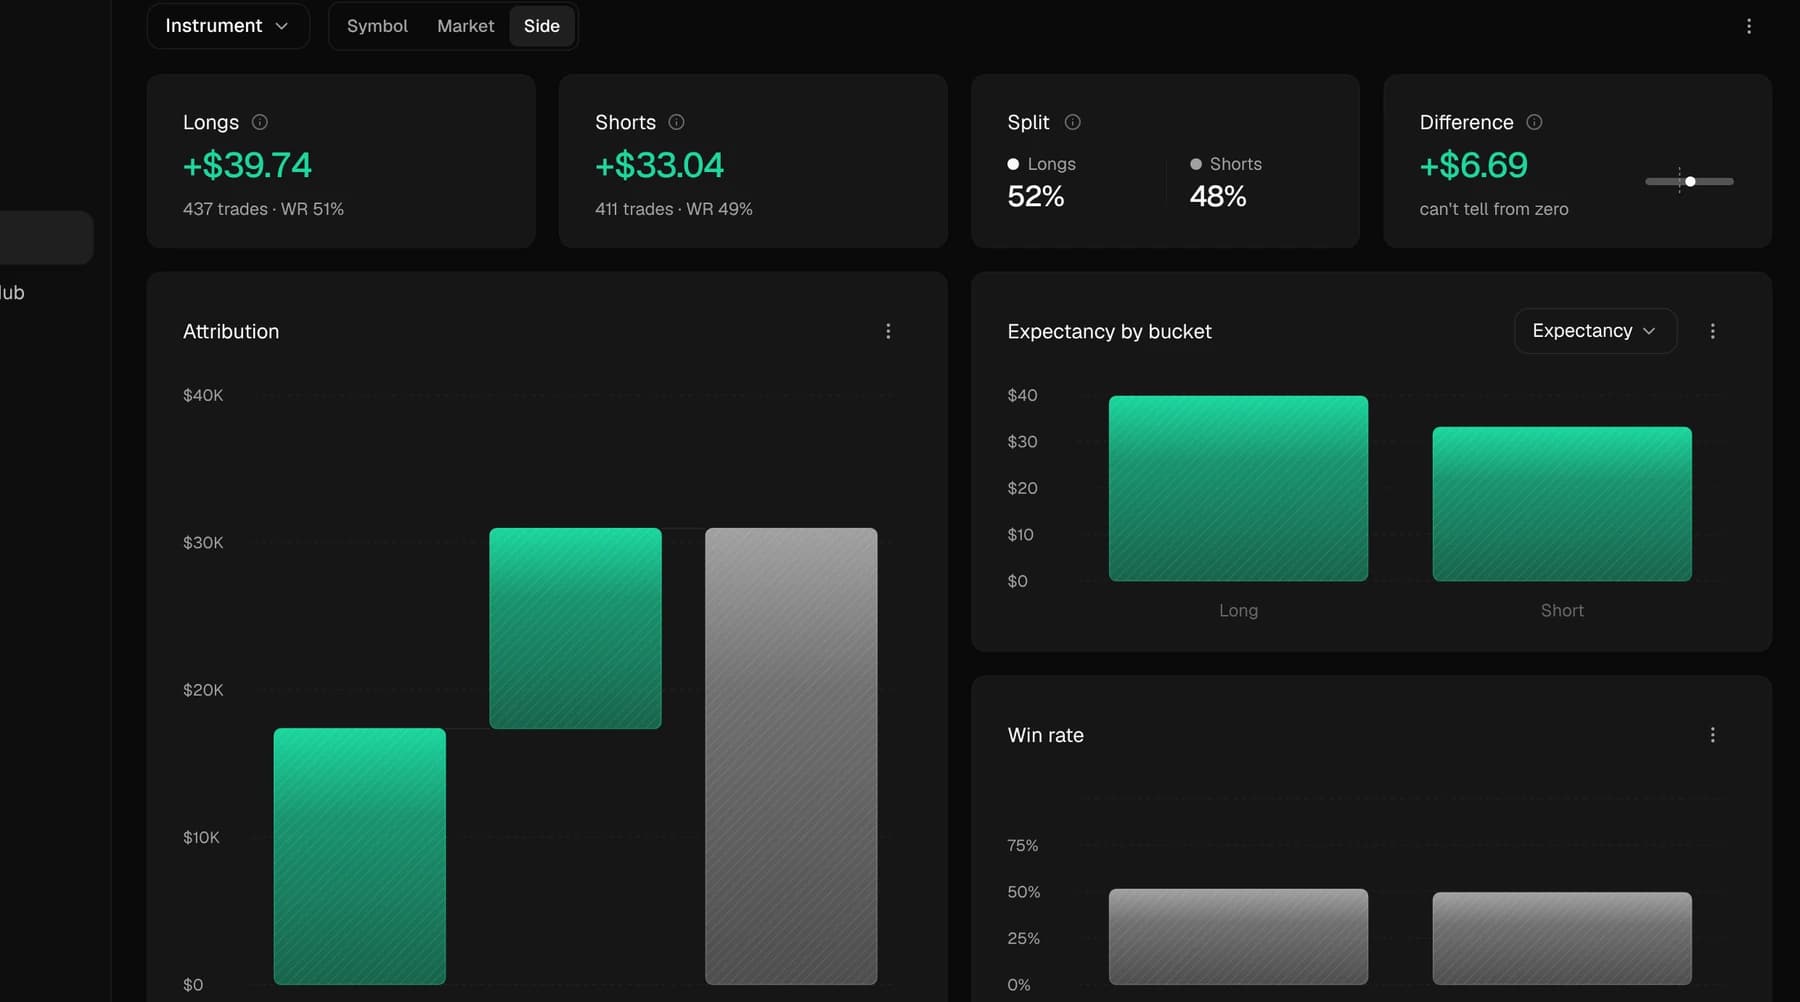
+$39.74 a trade long, +$33.04 short: a difference you can’t tell from zero.
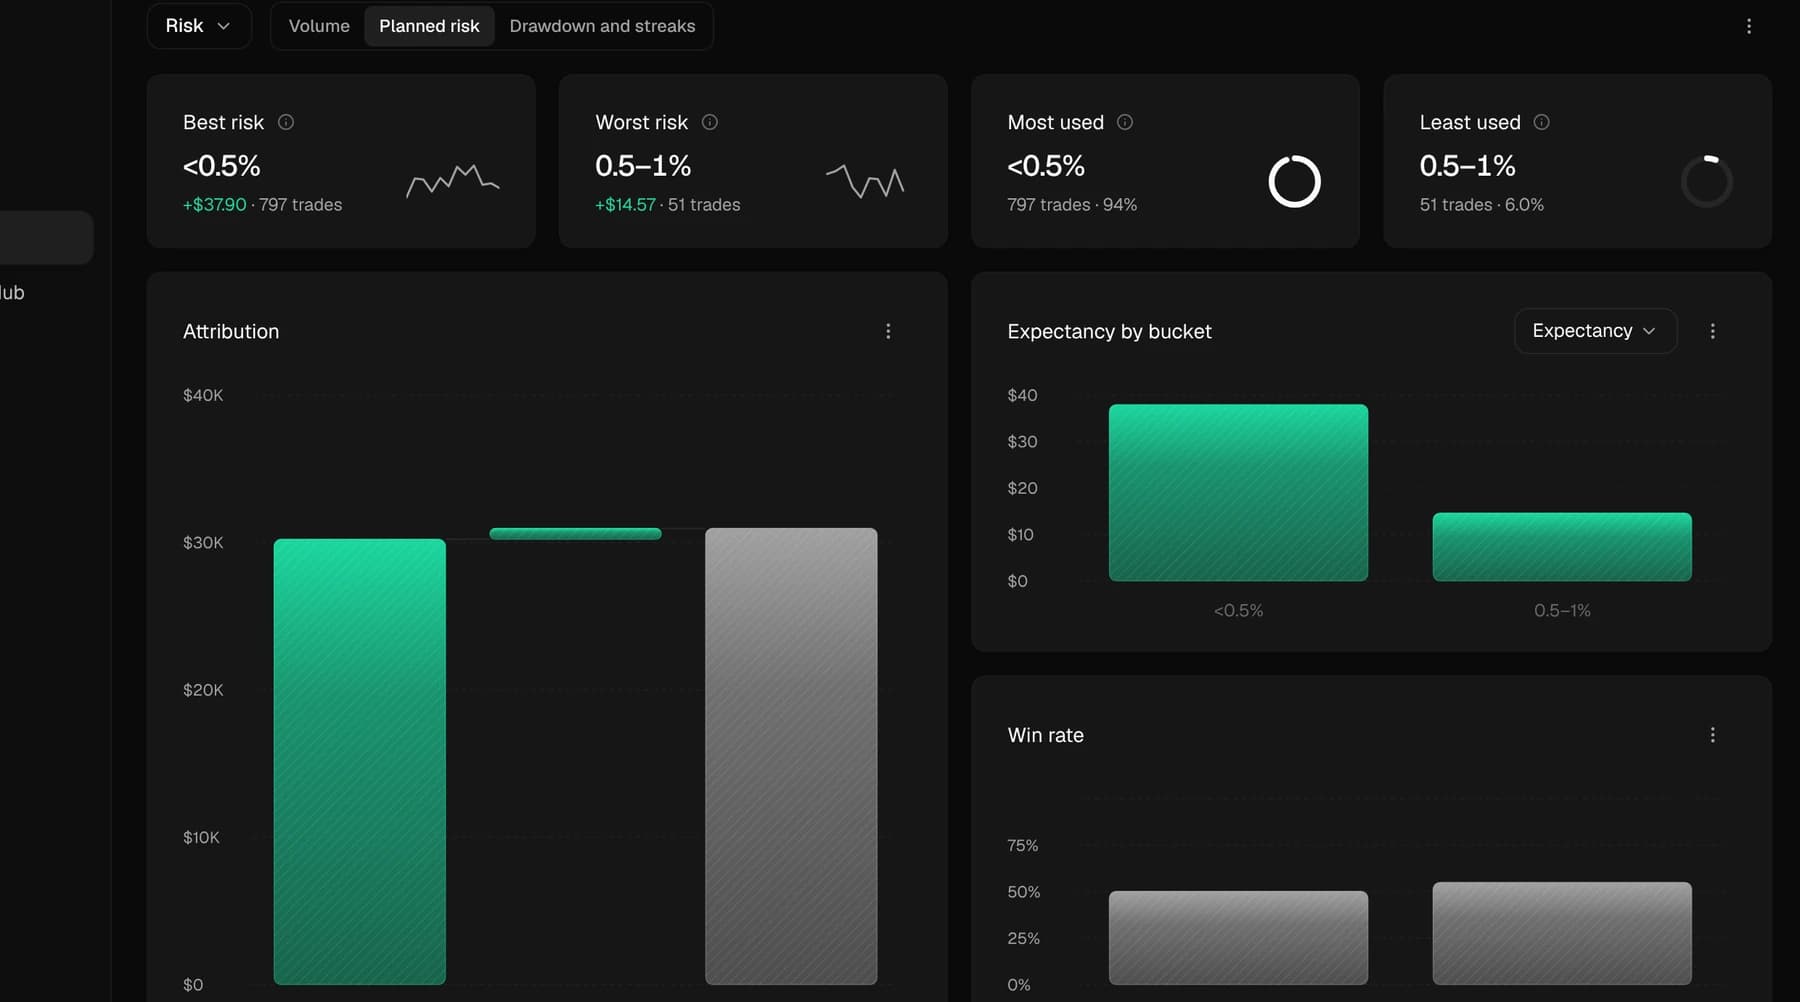
Under 0.5% of the account: +$37.90 a trade. Between 0.5% and 1%: +$14.57.
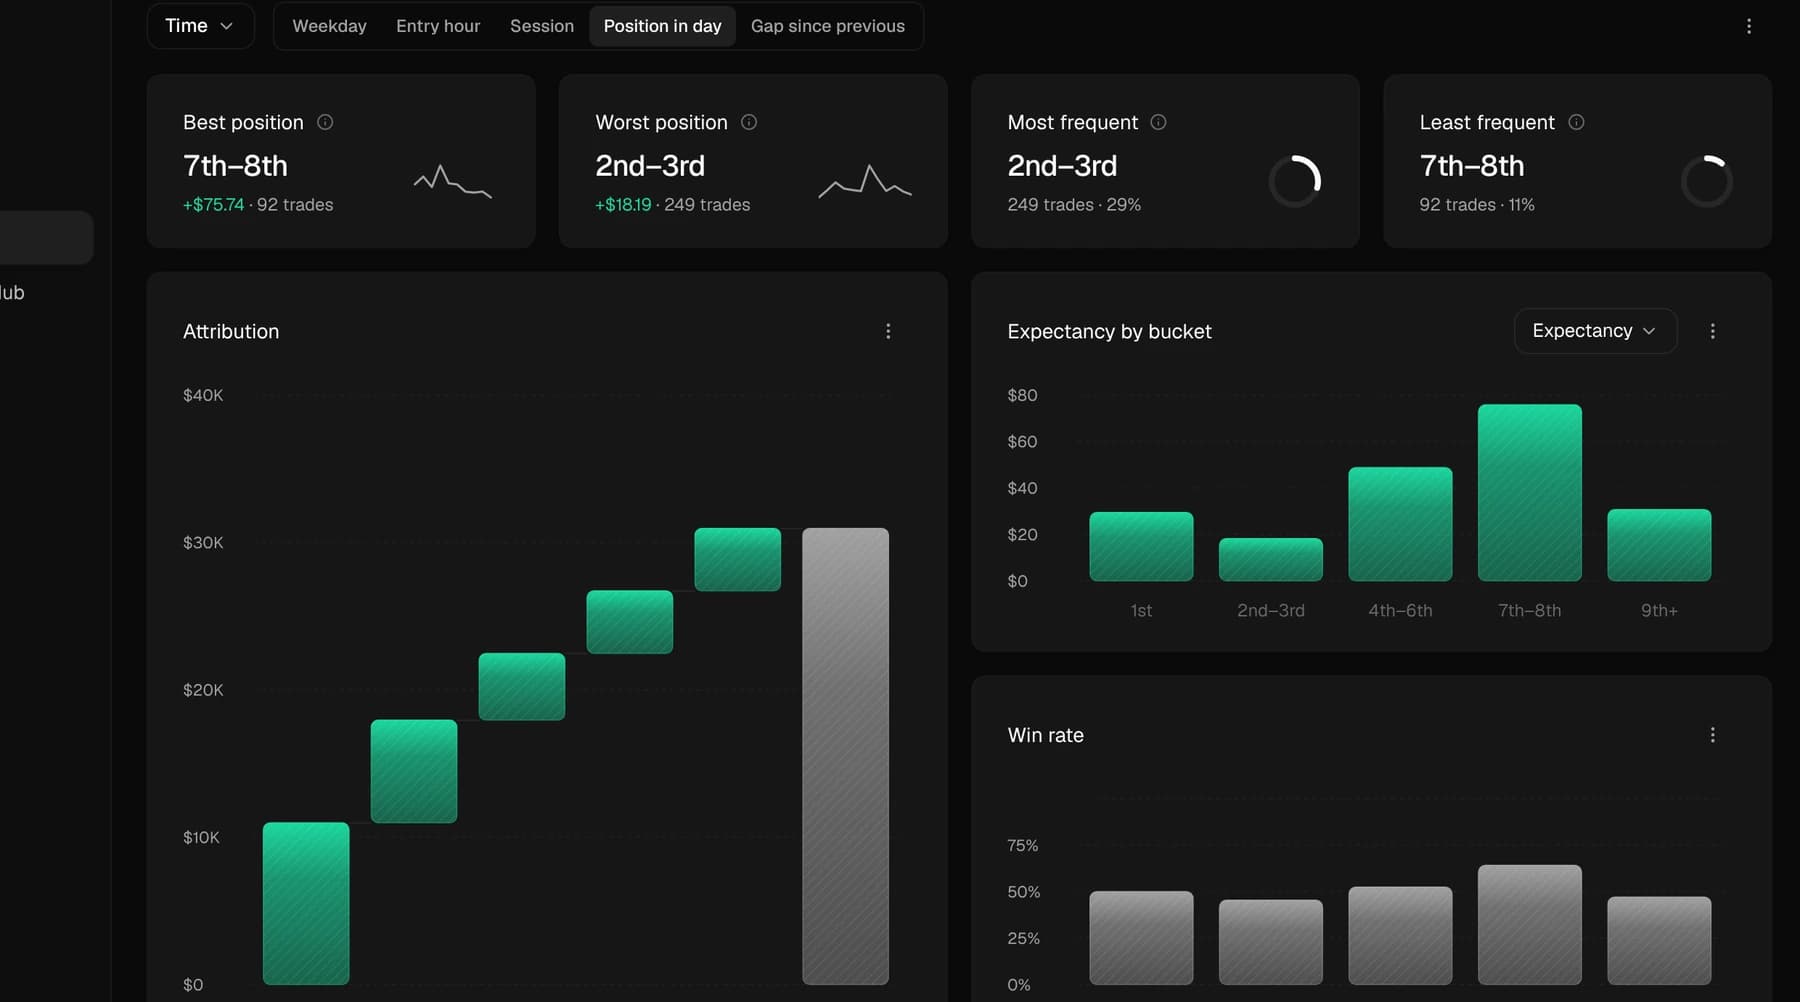
Your 7th and 8th trades pay +$75.74. Your 2nd and 3rd, +$18.19.
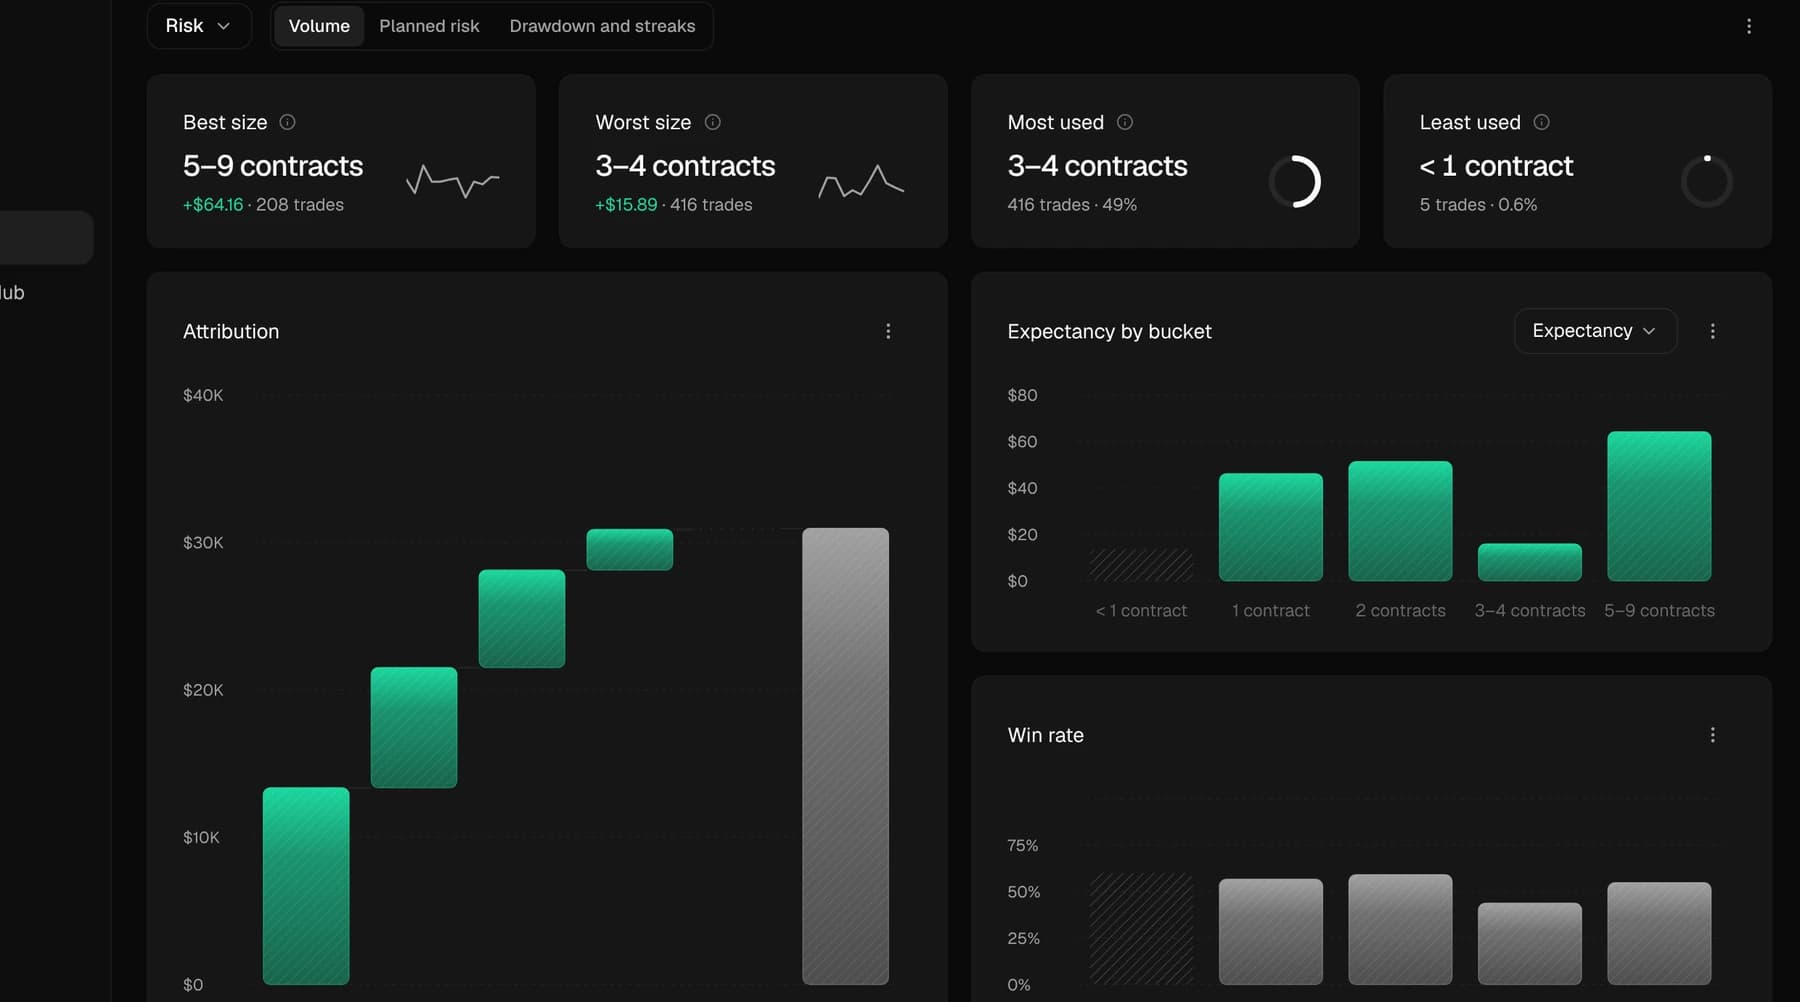
5 to 9 contracts: +$64.16 a trade. 3 to 4, the size you use most: +$15.89.
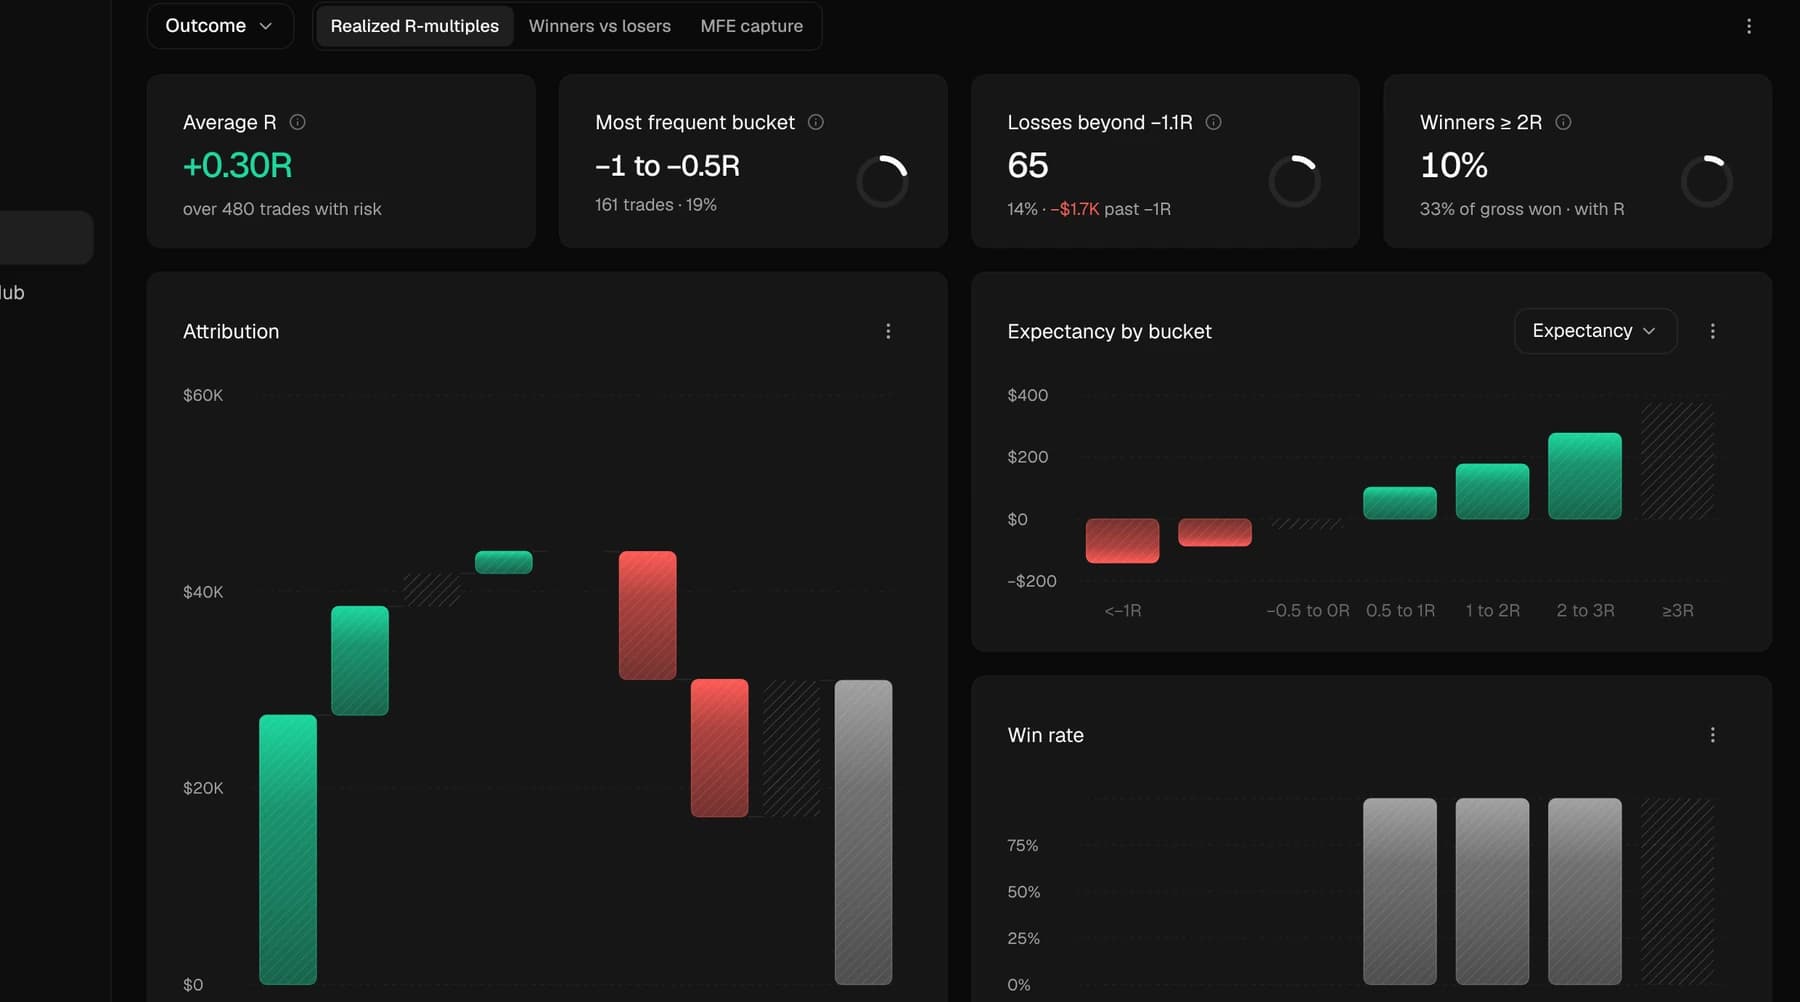
+0.30R on average, and 65 losses that ran past −1.1R cost $1.7K.
Three questions every trader asks after a good month, answered with statistics from your own trades.
Set a take profit, a break-even or a trailing stop and the Lab replays every trade on its 1-minute bars with the new rule. Real and simulated, side by side.
Your expectancy with its 95% interval, from +0.18R to +0.42R, how many trades it takes to prove it and how much of it survives without your best trades.
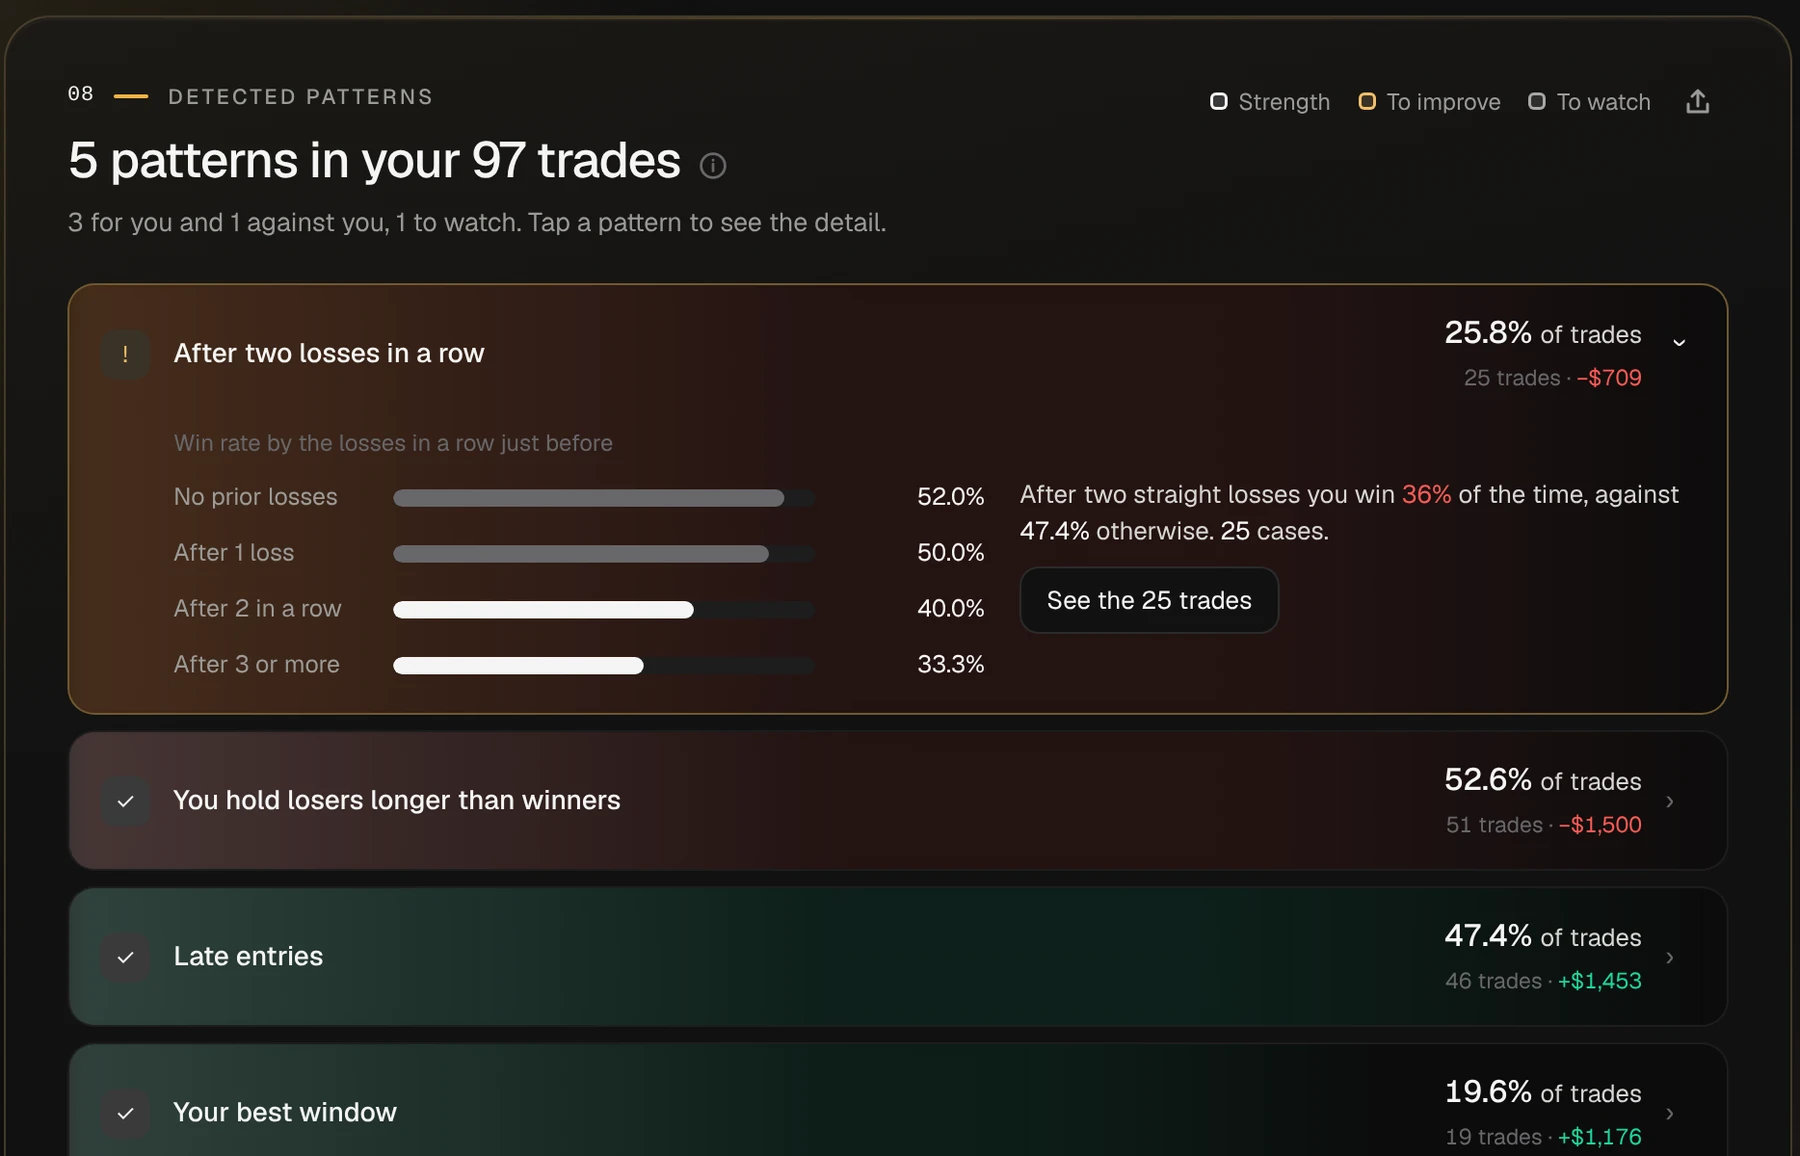
Setup by setup, and the habits that move it: after two losses, late in the day, oversized trades. Each one against the rest of your trades.
Every Monday at 00:00 the week closes itself, chapter by chapter: from one sentence to the plan for the next one.
The weekly report arrives on its own. The monthly one, on the 1st of each month.
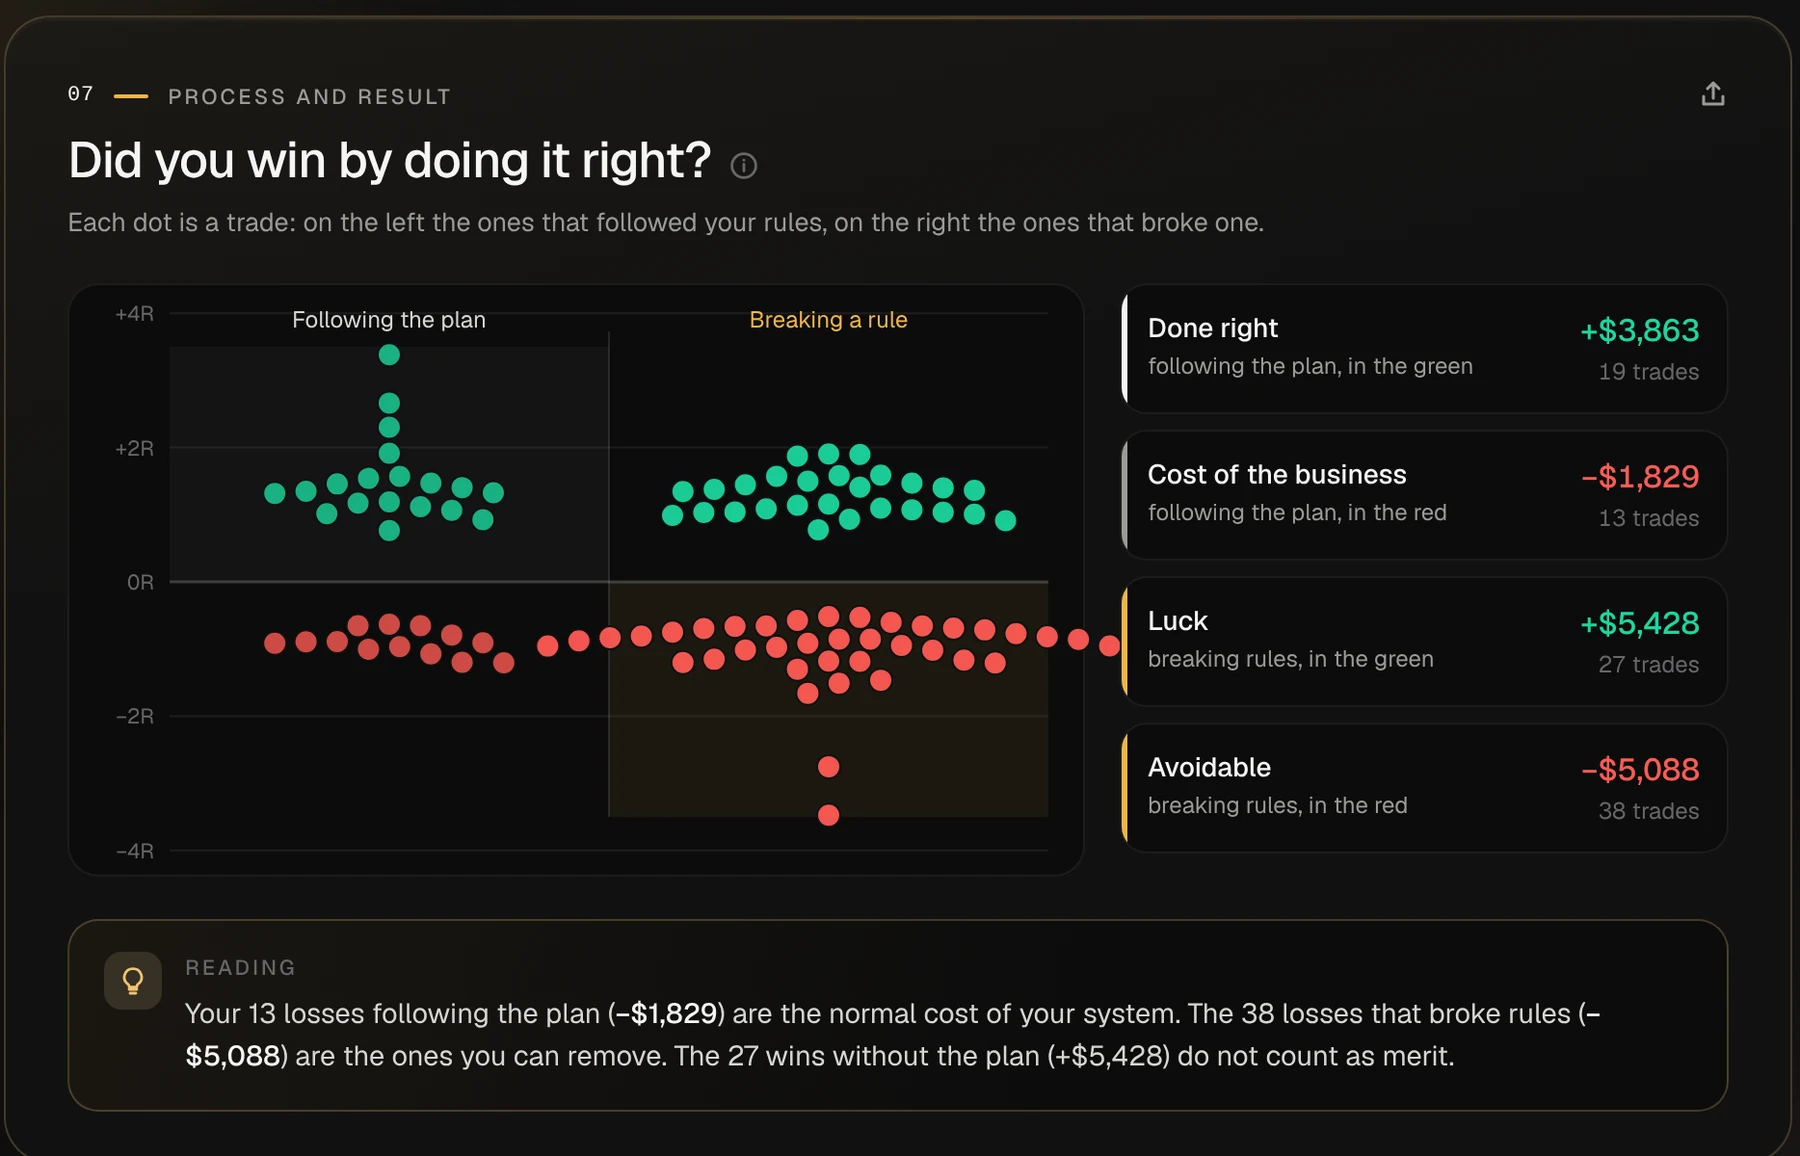
Each trade sorted into done right, cost of the business, luck and avoidable.
Two rules for the next week, the ones with the most impact on your trades. Keep them in the Consistency Hub with one click.
Start reading yourself.
Import your trades once. Every chart on this page is waiting on the other side.